
One plan for Sales, Operations and Finance.
Integrated planning, profitability and working capital on top of your ERP and your Excel. You keep what already works and we add what is missing.
Your planning was built for a stable business. The business is no longer stable.
Integrated planning, from demand to P&L.
IBP connects forecast, costs and budget on a single platform. When Sales changes its projection, production, costs and P&L recalculate automatically.
Everything your IBP needs
Budget and rolling forecast
Budgeting by component and scenario, with instant consolidation and variance alerts.
Profitability
Margin by SKU, customer, channel and country, with Customer Contribution and Cost-to-Serve.
Scenario simulation
"What-if" in minutes for inflation, costs or exchange rates. Foreign-currency revaluation and FX impact.
Working capital
Days of inventory, collection and payment in real time. Collections platform integrated with your ERP.
Financial statements and BI
Online reporting, consistency controls and audit traceability.
Variance analysis
Understand what changed between plan and actual, and why, without building another spreadsheet.
See your IBP at work
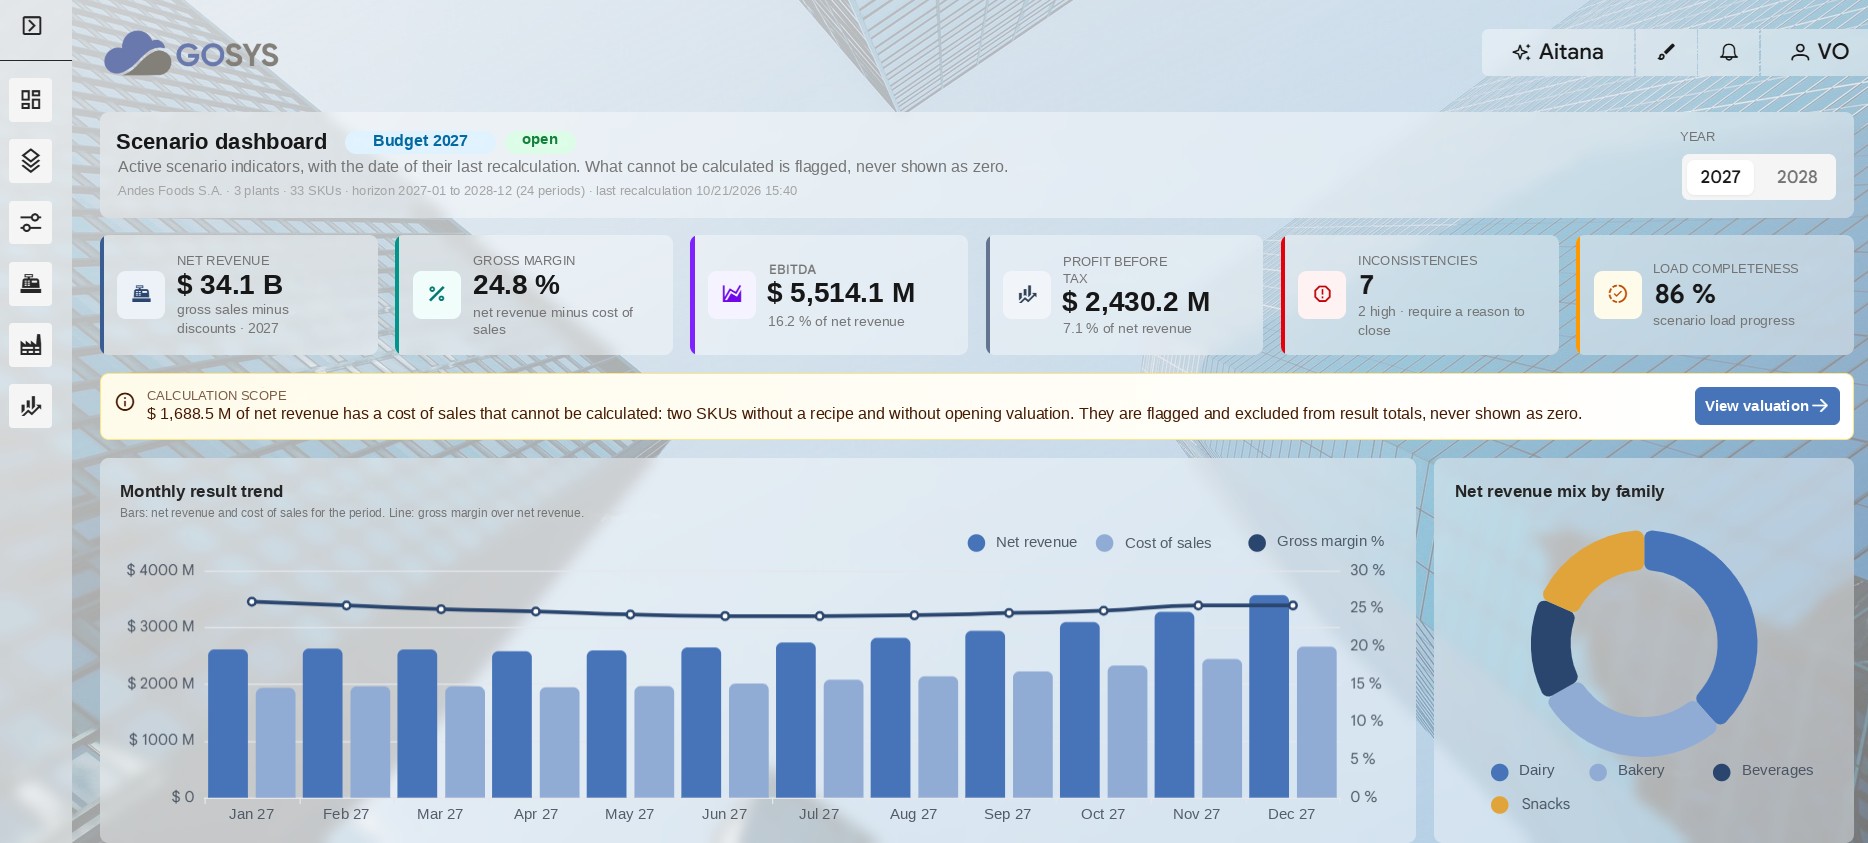
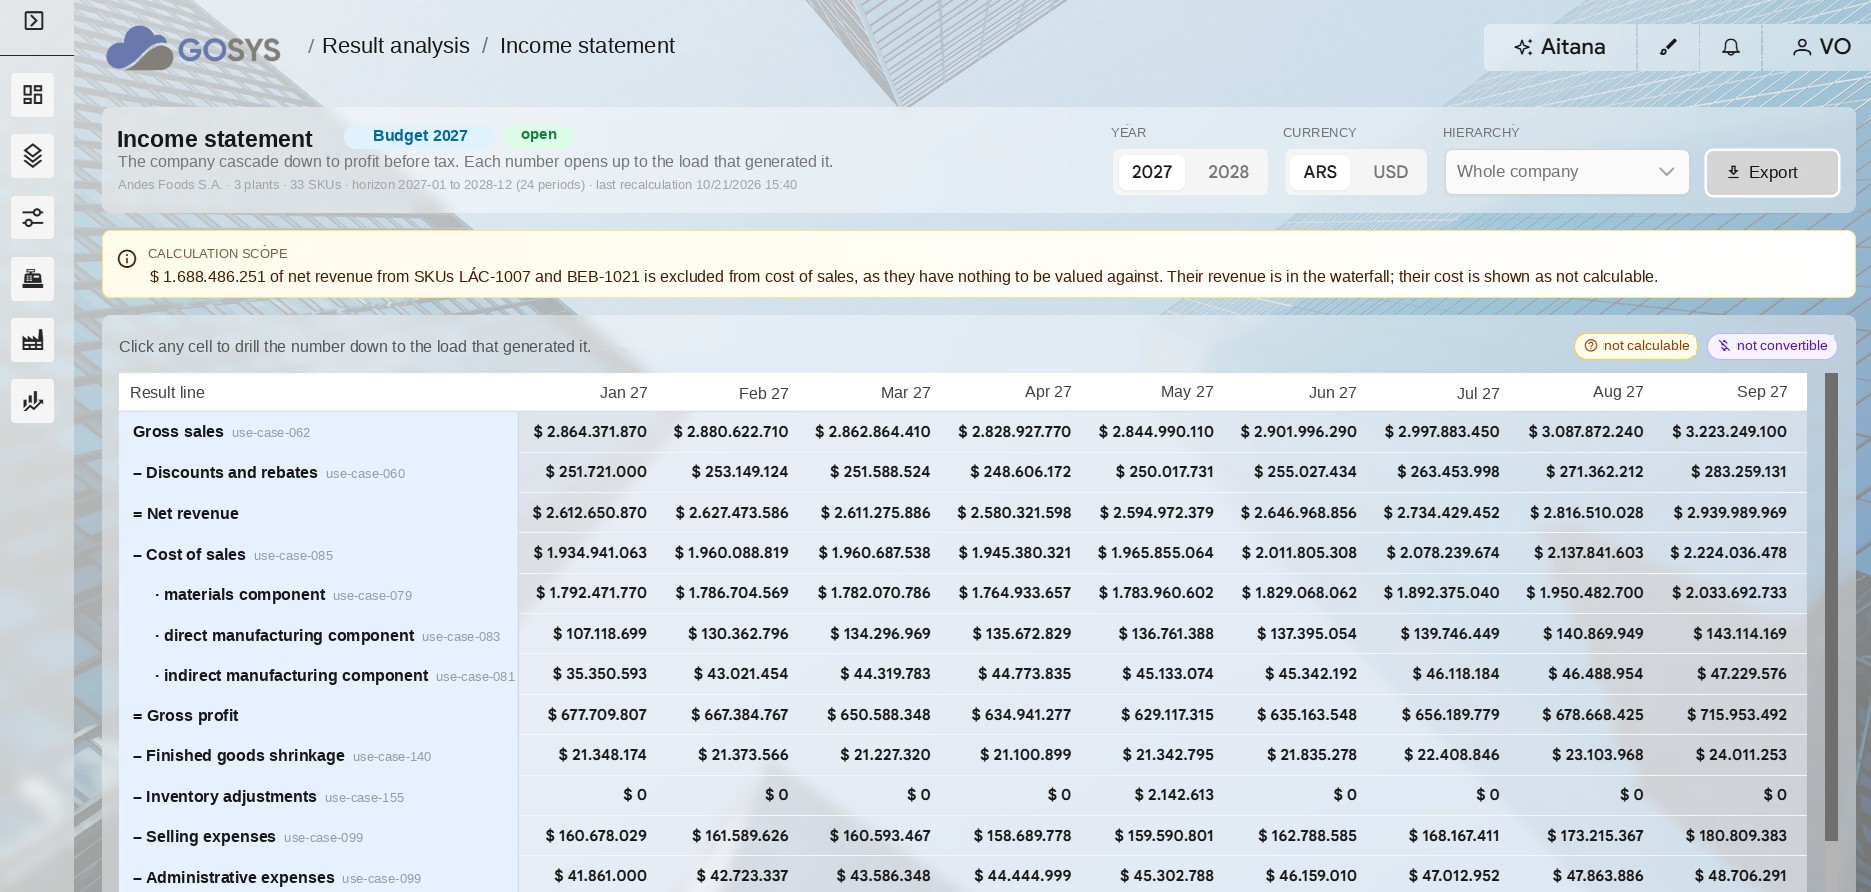
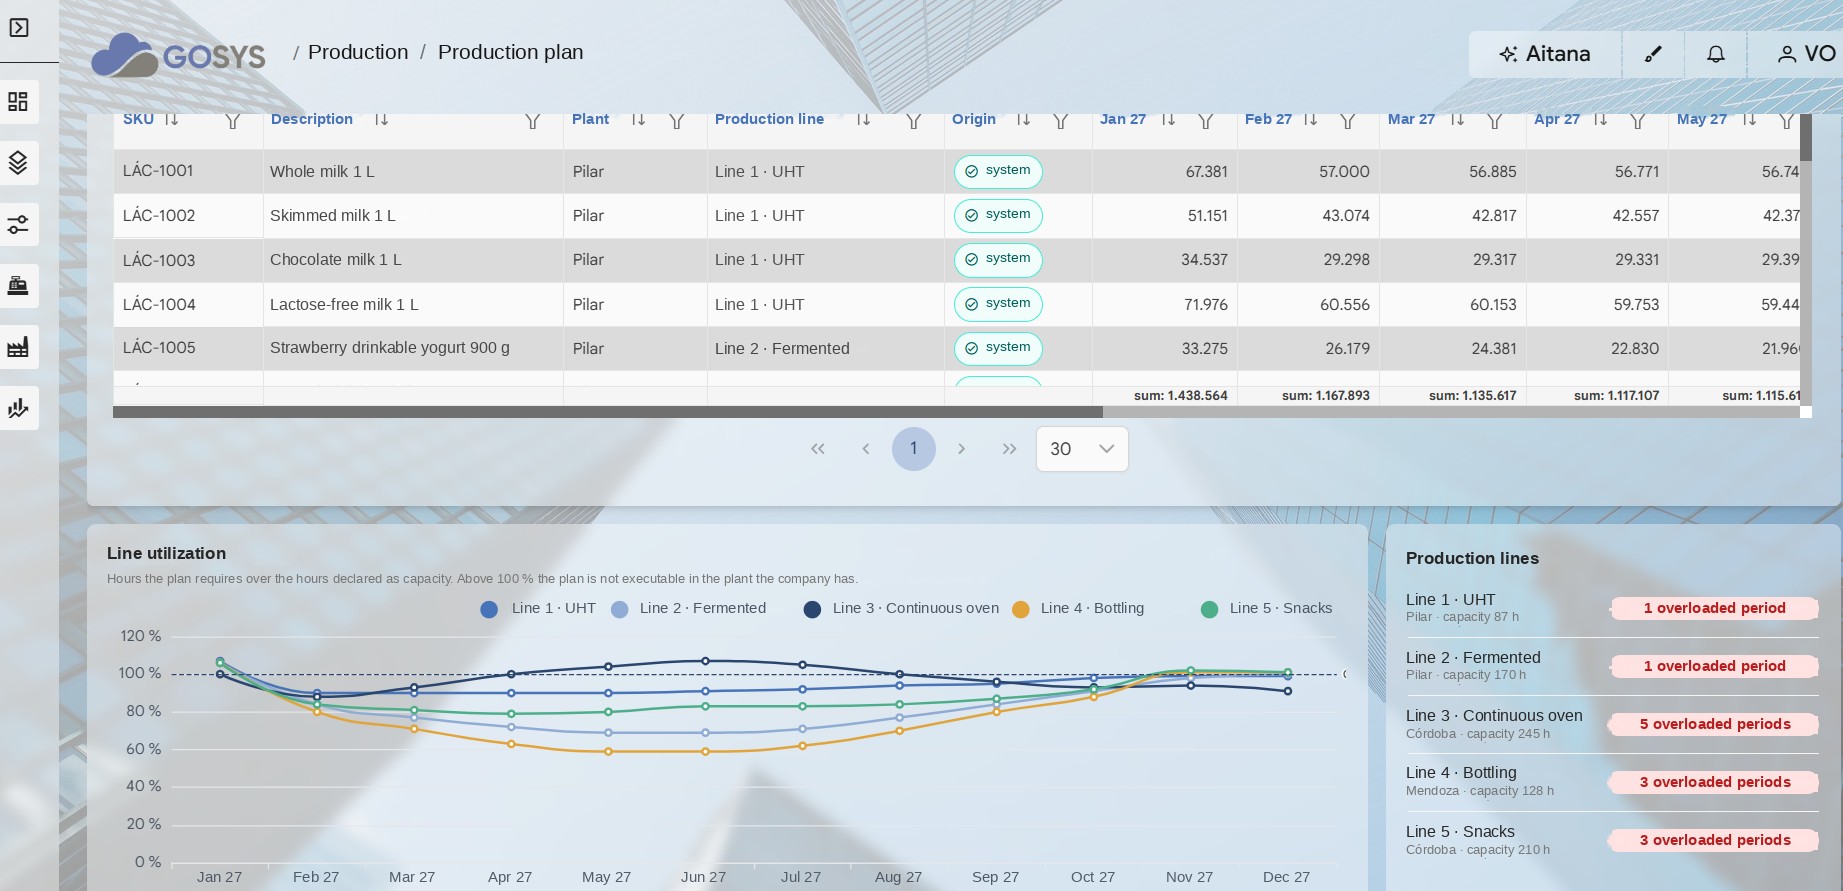
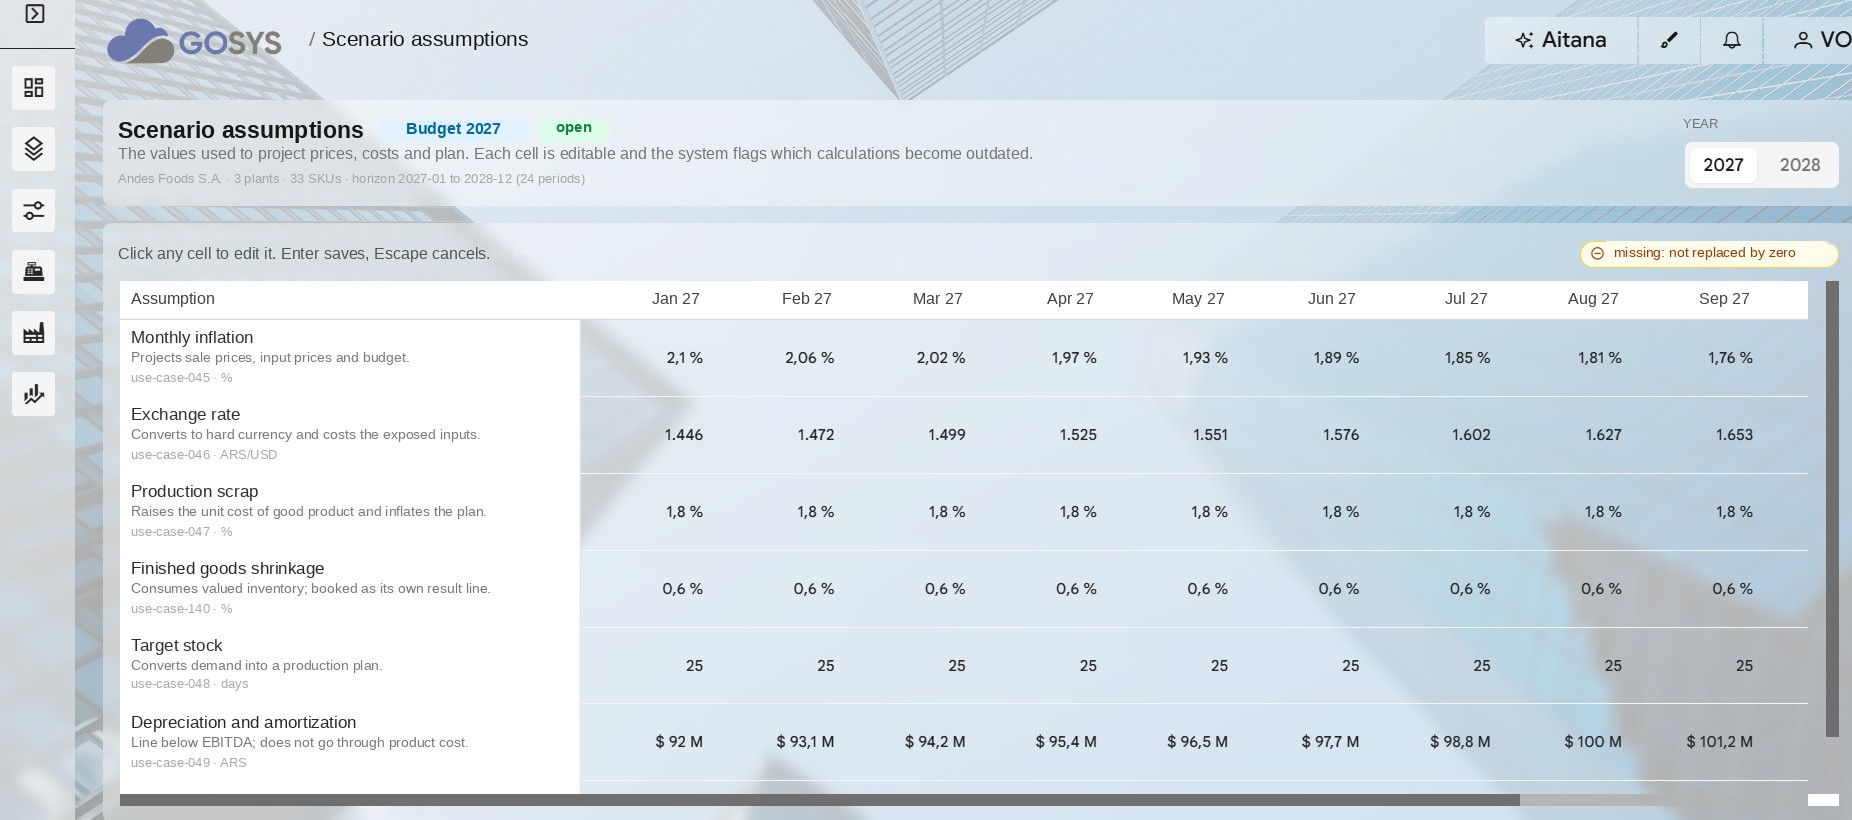
From 14 spreadsheets to a single forecasting hub.
A consumer goods group consolidated plant teams working in Excel into one platform, with forecast at SKU, component and customer-branch level.
- P&L and profitability simulation by SKU and customer
- Less planning time and faster business cases
- A single source of information for Finance and Supply Chain
- Automatic data-consistency controls
Results you can feel
How we deliver these results
A four-stage method, from diagnosis to scale. The same experts who design the process are the ones who build it: nothing gets lost in translation between business and systems.
Diagnosis
Understand before proposing.
- Interviews with Finance, Sales and Supply Chain
- Review of processes, data and systems (ERP, Excel)
- Prioritized gaps and quick wins
Design & build
Process first, technology second.
- Target process and business rules
- Data model on top of your ERP and Excel
- Build and validation with real data
Implementation
Go-live side by side with your team.
- Integrated testing and parameter tuning
- User training
- Go Live and post-launch support
Scale
Grow in stages, never from zero.
- Staged roadmap
- New features and business units
- Continuous evolution with monthly consulting
How many versions of the plan does your company have today?
Let's run the diagnosis in 30 minutes. No commitment.

